The reason behind my choosing this subject is twofold.
Firstly, I thought I should take up a topic which is relevant to all of us gathered here. Secondly, I thought that the problem under consideration should be a greatly unresolved one, therefore one which greatly influences the socio-economic fabric of our dear motherland.
It may be news to some of you that over 1.2 million people die each year on the roads globally, and between 20 and 50 times of that number sustain non-fatal injuries. In most regions of the world this epidemic of road traffic injuries is still increasing.
Burden of road traffic injuries
The burden of road traffic injuries falls disproportionately on people of low- and middle-income countries. Only 8.5% deaths occur in high income countries as against over 90% deaths in low- and middle income countries. This is in contrast to considerably high per capita number of motor vehicles in high income countries. It is interesting to note the declining trend of road traffic deaths in high income countries over the past few decades. Many high income countries have been able to reduce their road traffic injury burden by up to 50% over the last few decades.
Today, road traffic injuries are the ninth leading cause of death in the world and the World Health Organization predicts that road traffic injuries will rise to become the fifth leading cause of death by 2030.
Why do road traffic crashes occur?
Injuries are still called ‘accidents’ implying a sense of randomness and unpredictability. Many blame the injury on the victim and its consequences on the victim, and imply they are just rewards for careless or illegal behaviour. But knowledge and practice show that it is not so. Road traffic injuries are largely preventable and predictable; it is a human-made problem amenable to rational analysis and countermeasure.
| Table 1 |
 |
The causation of the road crash could be explained in several ways. One such approach is user performance Vs system demand. The user performance is the level of performance of the road user, say for an example, the driver. The system demand is the level of demand called upon from the road user due to the characteristics of road conditions, climatic conditions, and road discipline of other road users and road worthiness of vehicles.
The poorer the road conditions, higher the system demand required to overcome poor road conditions. Road crashes take place when user performance comes down and/or system demand goes up.
The second is the epidemiological approach.
Diseases are caused due to interaction of four factors; THE HOST or the man who contracts the disease, THE AGENT who causes disease, THE VECTOR who brings the agent to the host and lastly THE ENVIRONMENT conducive to disease (Figure 1).
The environment in this context is both physical and socio-cultural environment. If you apply this model to Malaria, the host is the man who falls sick with Malaria, the agent is Plasmodium and, the vector is mosquito Anopheles. Let us now apply this to road traffic injuries.
The example given is based on an incident in which a man is injured when his motorcycle skids and crashes on a slippery roadway. So, the host is the RIDER, the agent is the COLLISION or the MECHANICAL FORCE or THE ENERGY and the vector is the MOTORCYCLE which brings this force to man.
In fact in any type of injury the injury causing agent is the ENERGY which could be mechanical, electrical, thermal, radiant or chemical depending on the circumstances.
Alarming trend of road traffic
injuries in Sri Lanka
The magnitude of the problem of road traffic injuries in Sri Lanka has ever been increasing since independence and significantly escalated after 1977 when the liberalised economy was introduced to the country. South Asia will record a largest growth in road traffic deaths with a dramatic increase of 144% according to World Bank’s traffic fatalities and Economic Growth Project. Mind you, we too belong to this region.
| Table 2 |
 |
Approximately 1 in 50 deaths occurring in Sri Lanka is due to road crashes at present. That is to say when one attends 50 funerals the 50th could be a death due to a road crash. But it may not be so to most of you in this audience because a significant majority who die due to road crashes are from lower strata of the society
During the past few decades, fatality due to road traffic injuries have also increased. The Fatality Index for any disease is the percentage of deaths from the total number who contracted the disease.
This can be applied to Road traffic crashes as well. You can observe an increase in the fatality index from 7.8% in 1980 to 9.7% in 1998 (Kumarage et al 2000). This means one is more prone to get killed following road traffic crashes now, than a few decades ago.
Cost of road traffic injuries
Injuries and disability resulting from road traffic crashes are a significant drain on economies, typically consuming between 1 to 3 percent of a country’s gross national product per annum.
By far the largest portion of property damage stems from damage to vehicles which is called property damage. Police and administration costs are usually low when compared to other cost components. Lost output refers to the lost productive capacity of those affected by road crashes and is typically the largest part of casualty-related costs. It can range from as little as one day of lost time for a slight casualty to up to decades of foregone work for those killed or permanently disabled.
| Table 3 |
 |
Direct medical costs generally constitute a small proportion of the total cost of crashes. However, the burden of casualties on scarce medical sector resources is likely to be significant. Also, the medical costs will often be the first economic burden experienced by the victim’s family.
Medical costs and lost productivity do not capture the psychosocial losses to those injured or to their families associated with pain; grief and suffering, often termed human costs. These costs might possibly exceed the productivity losses and medical costs associated with premature death, were they accurately quantified.
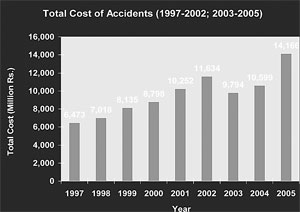
The total road crash cost in Sri Lanka, estimated using the Human Capital Method for year 2005 was Rs. 14.17 billion which is about 15% of the total health expenditure for Sri Lanka during the same year (Figure 3).
You can appreciate the fact that the total road crash cost has been more than doubled during the period from 1997 to 2005.
Vulnerable road users
Although all types of road users are at risk of being injured or killed in a road traffic crash, there are notable differences in fatality rates between different road user groups.
In particular, the “vulnerable” road users such as pedestrians, and two wheeler users are at greater risk than vehicle occupants and usually bear the greatest burden of injury.
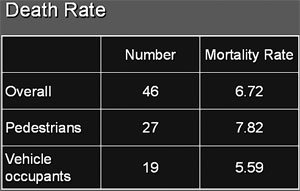
Because this vulnerable group is found in smaller numbers in United States, more than 60% of road crash fatalities occur in drivers. In contrast, in the least motorised countries drivers make up less than 10% of the deaths due to road traffic injuries. A study by this speaker involving 685 injured road traffic victims showed a higher death rate of 7.82% among pedestrians as against 6.72% among vehicle occupants.
The same study revealed that the injury severity of pedestrians was significantly higher than vehicle occupants when measured by three injury severity scores, namely AIS, ISS and RTS.
These are very sophisticated ways of measuring the severity of injuries. This proves the poor plight of pedestrians as against vehicle occupants.
What are the vehicles causing injuries and deaths to pedestrians?
Much against the popular belief, it is the light vehicles that are most frequently causing injuries to the pedestrians. The above mentioned study by the speaker showed that every fourth injured pedestrian suffered injuries due to collisions with motor cycles and, every fifth injured pedestrian suffered injuries due to collisions with three wheelers.
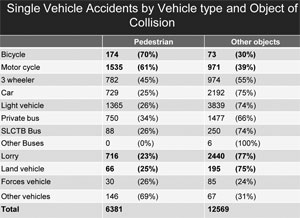
Table 1 throws light on some interesting revelations indicating that the smaller vehicles are those more frequently involved in collisions with pedestrians than the larger vehicles.
For example, of the crashes involving bicycles, as a single vehicle, 70% have been collisions with pedestrians. In the case of motor cycles too, it is 61%. Whereas in the case of larger vehicles, it is usually collisions with other fixed objects; in the case of lorries it is about 77% and land vehicles it is about 75%.
It has been established that, on average, pedestrians suffer more severe injuries compared to vehicle occupants as a result of road traffic crashes. Compared with injured vehicle occupants, pedestrians sustain more multi-system injuries with concomitantly higher injury severity and mortality. Despite the size of the pedestrian injury problem, research to reduce traffic related injuries has concentrated almost exclusively on increasing the survival rates for vehicle occupants.
The plight of the pedestrian who collides with a vehicle can be illustrated in the following manner.
Research suggests that about 85% of all fatally–injured pedestrians are hit by the front of a car; 15% are hit by the other parts of the car.
There are usually three phases in car-to-pedestrian collisions. In the first instance the pedestrian suffers severe injuries due to contact with different parts of the car front, mainly the buffer. It is usually the lower limbs that sustain injury at this point. The relatively low profile of most passenger cars results in an impact below a pedestrian’s centre of gravity which make the pedestrian to fall over the bonnet. This is the second phase.
The hip, head and chest can sustain injuries at this point. The third phase is contact with the road surface when the pedestrian rolls over on to the road. While the severe head injuries are primarily responsible for fatal outcomes, injuries to the lower limbs are mainly responsible for long term disabilities. This sequence of events shows that as a result of a collision a pedestrian sustains injuries not once, but several times.
What can we do about road
traffic injuries?
Controlling road traffic injuries needs a thorough understanding of the problem in the context of a given society. The solution lies in the problem itself. Therefore, it is worthwhile once again looking at two approaches used to understand the problem of road traffic injuries.
Like in any other disease, in controlling road traffic injuries, the interventions can be targeted at the host, agent, vector and, environment. There are specific measures targeted at each of these factors.
We could use Haddon’s Matrix to illustrate this. Haddon who is considered as the father of injury control invented this matrix in 1960s which is now used in every form of injury control applications.
On the horizontal line, you find the four factors responsible for the occurrence of road crashes. Vertically, you find the time line of a crash that is pre-crash, crash and post-crash. For an example we will take up factors at the time of crash. Failure to wear a seat belt will act at the time of crash in imparting injury to vehicle occupants. Therefore, wearing the seatbelt is a human factor operating at the time of crash leading to prevention of a possible injury to vehicle occupants.
Consider the user performance-system demand approach. Road crashes take place when user performance comes down and/or system demand goes up. Therefore, all measures aimed at preventing road crashes involve increasing user performance and reducing system demand. Increase in road user performance includes driver education, road discipline, enforcement and other measures. Reducing system demands include proper vehicle design, correct highway design and maintenance and other measures.
Conclusion
I would like to end by posing a question. Should we continue to put the blame on other road users – who unfortunately would take a long time to change due to their socio-economical backwardness and wash our hands off? OR as a responsible educated and the so called elite group of the society be mindful of these causative factors and go this extra mile to break the vicious cycle?
This small step each one of us take, would make a world of a difference, in decreasing the road traffic crashes in our country. |

