Columns
Economic growth: Puzzles and paradoxes over pluses
View(s): For quite some time the country’s economic growth statistic has been greeted with scepticism. There have been inconsistencies and contradictions that have made it difficult to accept the official estimates as accurate.
In 2011 the growth figure was trotted out even before the year was out. Interestingly, the figure given before the data was collected and analysed turned out to be the final figure of growth. Officials who predict such accurate estimates must be having a good understanding of the ground situation to be able to predict the economic performance to the first decimal place.
GDP growth in 2012
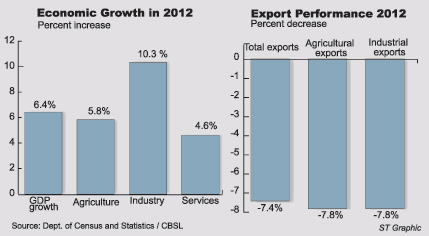
According to the Department of Census and Statistics, the economy grew by 6.4% in 2012, only marginally lower than the expectation of the Central Bank. An economic growth of 6.4% has been achieved despite a decline in agricultural and manufactured exports, a large trade deficit, drought and floods. It is a commendable achievement.
 Varying estimates
There were varying estimates of the expected growth rate. As is usual, the Central Bank’s estimate was the highest, and as usual, has been the closest to the final figure given by the Department of Census and Statistics, falling short by only just point 1 of a decimal: 6.4% compared to the projected 6.5%. How much more precise could a prediction be!
The IMF estimated economic growth in 2012 at 6.25%, while other estimates placed it below 6%. A studied estimate placed economic growth at 5.8% and believes it was increased to nearer the Central Bank expectation of 6.5%, falling short by an insignificant 0.1%. National accounts data being what they are; there is not much point in dancing around a few decimals.
National accounting
National accounting has inherent difficulties especially in an economy such as ours where there are no direct and accurate figures of production in many areas of economic activity. Informal enterprises predominate and many economic outputs are not counted. Informal economic activities are perhaps as much as 40% of GDP. Consequently GDP could be either over estimated or underestimated by the best intentioned statisticians. On the other hand, it is easy to introduce arbitrary statistics without firm figures. There are few areas in Sri Lanka’s national accounts for which there are firm figures. Consequently the integrity of those computing the accounts is important.
The statistic of tea production is one of the best statistics as the figures of all tea factory production are regularly submitted. There is also a close relationship between tea production figures and exports when allowance is made for the change in stocks. Similarly the rubber production figure is fairly accurate. Barring tea and rubber figures, other agricultural statistics are mere estimates.
 One would expect coconut production estimates to be accurate. This is not so as the bulk of coconut production is from home gardens. It is, therefore, impossible to count up the nuts produced in the country. Consequently estimates are made on a basis of a limited survey, per capita consumption estimates and figures from coconut estates. A scientific method of crop cutting surveys was adopted from the 1950s to estimate paddy production. Whether the current practices follow a rigid methodology is a question worth asking.
The biggest bias in agricultural statistics is that more than 50%of agricultural production is of other food crops. In 2011, tea, rubber, coconut and paddy accounted for only 37% of agricultural output. Other food crops — a large number of crops varying from vegetable, fruits, pulses grains and spice crops among others — account for the rest. The statistics of brinjals, tomatoes, cauliflower, chillies, bandakka and drumsticks and a whole array of vegetables and fruits is anybody’s guess. They are actually the guesstimates of grama sevakas and other officials who may like to boost production figures each year. In reality the output of these crops may be more, it could also be less, especially for a particular year. Similarly the estimate of many small industries and of services that are of an informal nature cannot be captured accurately.
Therefore what is important to realise is that all this fuss about the decimals or even a point in the GDP is misplaced taking into consideration the methods of collecting and estimating production figures. One must look at the 2012 estimates of national output in the light of these observations.
Agricultural output
Last year was a year of bad weather for agriculture. Tea production fell by 1.2% and tea exports declined by 5.8%. Rubber production declined by as much as 6.8 percent, while coconut production increased by 6%.
Despite paddy production being affected by drought and floods, paddy output declined by only 0.1%. This means that 2012 paddy production was hardly affected by weather: a hard fact to accept in the light of accounts of crop damage throughout the year. It is common knowledge that drought and floods affected a wide spectrum of agricultural production. It was estimated that about 30,000 hectares of paddy were affected by the drought and a further extent affected by floods.
With tea production declining by 1.2%, rubber production being 6.8% less and other crops too being affected by weather conditions that increased prices, it is difficult to accept that agricultural production increased by 5.8% last year. One plausible explanation could be that fisheries and livestock production increased. Coconut production too increased by 6%. The growth in the agricultural sector by 5.8% is most probably owing to growth in other food crops, livestock and fisheries. Since agriculture accounts for less than 12 per cent of GDP, this statistics is not of that much significance for the overall growth.
Manufactures
Last year saw a decline in manufactured exports by 7.8 per cent. This is a significant setback to industry. Despite this, industrial output is estimated to have increased by 10.3%. This may be attributed to a continuing increase in construction, especially of large infrastructure projects and increased mining output. Yet it appears to be a high figure given the setback to manufacturing exports.
Last year’s growth in services by 4.6% was one of the lowest in recent years. The growth in tourism by 20.2% contributed much to this growth. However, there were falls in other services such as in export and import trade.
Fresh perspectives on growth
An economic growth of 6.4% following a growth of 8.3% in 2010 and 8% in 2011 is no mean achievement. However, in view of the difficulties faced by the economy, one is entitled to interpret the growth statistic as a statistical artefact. Furthermore, the question that is being asked is how come with such high growth rates in three successive years the economy ran high trade deficits. In the case of India and China their high growth rates led to large trade surpluses.
This question raises issues regarding the sources, composition and quality of growth that must be looked into. In addition, despite GDP growth, several estimates as a proportion of GDP too fell. The revenue to GDP ratio fell to only 11% of GDP in 2012 compared to the revenue to GDP ratio of 14% in 2010. How is it that the growth in output was not captured in higher revenues? Is the lower ratio due to an exaggerated GDP in 2012?
There are serious concerns regarding the quality of economic growth that should be considered. A growth that leads to higher trade deficits, balance of payments difficulties and increasing foreign debt merit reassessment.It is opportune to take a new look at the country’s economic strategies rather than be obsessed with a dubious growth statistic.
Follow @timesonlinelk
comments powered by Disqus


