Share market returns in 2013 are in the hands of the SEC
 Requests to predict the future of an investment outcome is both pervasive and annoying. Most agents in the investment industry have built reputations, inflated egos and insanely inflated pay based on the folly of a supposed ability to predict what the future hold. Alas, after meeting more than a thousand fund managers and their various acolytes all around the world, I’m yet to find anyone who can successfully predict anything within a standard deviation of accuracy. The question about prediction and expectations play an important part in understanding what the local share market may hold in 2013. Investors are likely to get various communications over the next few months as to how much “value” the local share market currently offers and the ability of various colourful individuals to find such “value” for you. Most will struggle to define “value”, let alone find it. As one disastrous fund manager once put it to me “we know it when we see it”. History, specifically the performance of the local market over the last decade, may provide some answers to important questions. Irrespective of what the revolving door at the top of the SEC brings us in terms of a regulator, history holds better and more painful lessons for today’s investors than dexterous propaganda from agents.
In order to put some meaningful context around the local market performance, I analysed the comprehensive returns history from MSCI, the world’s largest provider of equity index data, for the Sri Lanka component as used in their Frontier Market index. The companies and weights are indicated in Table 1. While there are always idiosyncratic factors at play when using a handful of companies to make comments about the whole market, the six constituent companies have been a good proxy for the broader growth story of the share market over the last decade.
As expected, during phase 1, the country went through uncertainty and no one touched shares with a ten-foot barge pole. With inflation running at 22 per cent and the banks offering deposits at 30 per cent during 2006, why would you?Unfortunately, that’s roughly about the time many should have invested. Instead, the war comprehensively ended in 2009 and despair gave way to euphoria with markets rallying a staggering 400 per cent in 15 calendar months. In keeping with investor behaviour everywhere, less informed investors herded and bought dodgy companies with dodgier balance sheets and the last two years has been a disaster even for the better run blue chips. This much remains uncontroversial and may not even be news for many investors. However, understanding the risk in the market and where returns come from are more complicated.
The premise of share investing rests on the objective that your capital will earn higher returns than lending money to the government via bonds. In order to achieve this objective, a good investor must be patient and back the judgement of companies who venture into risks that may not pay off. Ideally, you are hoping for a 60-70 per cent chance of success (and a much lower 20 per cent in private equity). In order to take on this uncertainty and added volatility, you should get paid with a risk premium above bonds. One of the greatest puzzles in the investment industry remains the size of that premium.
Given the uncertainty around the “risk premium” the question becomes; what drove the returns during the three phases mentioned previously and are they repeatable and if so in what size?
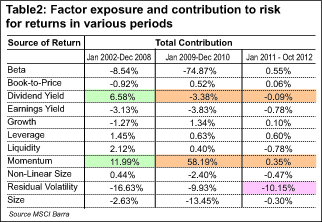
 As Table 2 shows, during the tumultuous (and boring from a stock market perspective) years from 2002 through 2008, dividends and thus higher quality was a source of returns, along with momentum (a decent measure of the herd instinct in bigger markets, but a more appropriate measure of liquidity in the local market).
However, things turn sharply as we come to the 2009-2010 period with momentum (and the herd) driving returns on the expectation of growth, with little regard for quality or dividends. The most interesting phase for me has been the last two years.
As shown, beta (or the market return) was a key driver as was leverage and momentum, but residual volatility has been the biggest detractor. Technically, the residual is the one that is not captured by any of the factors outlined here, but it’s also proof that the movements in value during the last two years were dominated by non-traditional contributors to investor returns.
Chief among the non-traditional risks has been regulatory uncertainty (poor governance in particular), which can’t be quantified, but does get shown up through all factors. Not only is the inability of the regulator to control agents disappointing, but bad agents are also having a disproportionate impact on generally good regulations being mooted by the regulator. Recently a few individuals have brought to my attention the moves by certain agents to water-down plans on regulating and disclosing related party transactions.
The returns from the local share market in 2013, stretched at the best of times due to structural deficiencies and sector  concentration, will be based on local regulatory reforms as much as they are on fundamental factors. Local investors will be hit with potential double whammy – anaemic global growth translating to a domestic balance of payment problem sending fundamental factors down and weak governance via a hamstrung regulator.
The former is unavoidable, the latter is not. It won’t matter if your broker is trying to argue how much “value” is in the market, if the market is dysfunctional. The return of your capital may just be as important as the return on it.
(Kajanga is the founder of the Delaware-based Centre for Investor Behaviour and currently resides in Sydney, Australia. You can write to him at kajangak@gmail.com)
Follow @timesonlinelk
comments powered by Disqus


