International investor preference continue to remain strong for Sri Lanka
Dr. Nimal Sanderatne, in his regular column and in a response appearing elsewhere in The Sunday Times of May 25, has raised a few important economic concerns that require attention.
The main thrust of the response by me that appeared in The Sunday Times of May 11th, was to highlight certain matters that contradicted the contention made at the recent LBR/LBO forum that the Geneva resolution had an impact on international investors’ confidence on Sri Lanka. Interestingly, Dr. Sanderatne has now conceded that the recent Geneva resolution may not have had a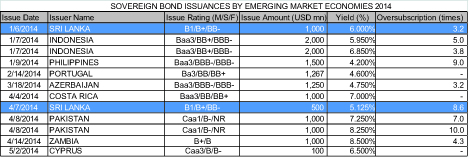 significant economic impact, after all, and that is an important outcome arising from the response. In the article on May 11, this writer also presented actual facts and figures from an international perspective in order to make a proper comparison of the International Sovereign Bond (ISB) floated by the Government of Sri Lanka (GOSL) prior to and after the Geneva resolution. That information showed that the most recent ISB had been raised at an incrementally reduced cost of financing, but had also improved based on globally accepted performance yardsticks, such as issuance spread over its benchmark of similar US Government Treasury instruments, performance of ISB compared with similar rated countries, global investor preference measured by oversubscriptions, new issue premium, secondary market performance, etc. It is noteworthy that the ISB under reference was issued at negative new issue premiums and widely reported in the international financial press and commentaries. In addition, the writer presented how the external trade had performed and how significant improvements had been reported in other macroeconomic variables including that of Foreign Direct Investments (FDI).
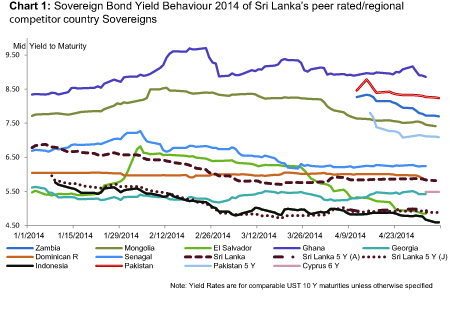 In that background, the contention that Sri Lanka contracted ISBs at a high cost is misleading. The comparison of Sri Lanka’s ISB among Asian economies is also misleading given the fact that Asia includes Japan, China and other economies of a much higher credit rating. However if Dr. Sanderatne had applied the international parameters of peer rated/regional competitor country borrowing costs in 2014, the true picture of how competitive that the ISB contracted by Sri Lanka in 2014, would have been clearly visible.
Looking beyond the ISB issuance, the performance of Sri Lanka ISB in the international capital markets also confirms the continuing investor preference for Sri Lankan paper. In practical terms, the Sri Lankan paper continues to trade at premiums in the secondary market whereas the majority of peer rated/regional competitor country Sovereigns in the international capital markets trade either at par or at a discount.
Outside the ISB, the continuous foreign investor preference for T-bills and T-bonds is yet another measure of international investor preference. The maximum limit for foreign investments in T-bills and T-bonds has been capped in Sri Lanka at 12 ½ per cent of total outstanding as a proactive policy measure, and the authorities have not been tempted to attract short term foreign investment in recent times by relaxing such threshold to attract short term investment in government securities as a result of QE. Instead, the 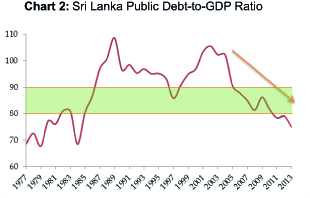 authorities have been consistent in its policy of attracting investments, starting from pre-QE era, from investors who have a serious and long term view on Sri Lanka. As a result, foreign investor preference has remained strong, with government securities recording net inflows to the maximum available limit and that has also partly supported the maintenance of a low and stable interest rate structure in the country.
Annual Foreign Net Inflows
to the Government Securities,
Year Net inflow (USD MN)
2010 466.70
2011 227.29
2012 843.34
2013 492.68
2014 (Jan-May) 229.39
In addition, the Average Time to Maturity (ATM) of the public debt stock in Sri Lanka has also improved in recent years with the ATM which stood at 5.3 years in 2009 improving to 5.7 years by 2012. By 2013, the ATM has further improved to 6.9 years. The share of 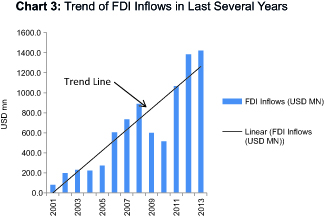 outstanding foreign debt of the government also declined to a level of 34.1 per cent of Gross Domestic Product (GDP) in 2013, from 36.5 per cent in 2012.
It is also important to recognise that the reduction in public debt has to be gradual and not, as some contend, got to be reduced overnight! The decline of public debt as a share of GDP in Sri Lanka has also to be analysed from its evolution over the years. From 1985 to 2009, for 24 years, the public debt to GDP ratio remained well above 80 per cent in Sri Lanka, with the ratio at times being well above GDP as well. By 2013 it had declined to 78.3 per cent, continuing the recent declining trend. Still, some argue that the recent robust economic expansion has come via debt financing, and that therefore, future generations are exposed. In this connection, it may be worthy to note, that the public debt, in recent years, has been contracted primarily for the infrastructure development in the country, in the context that the deficit in infrastructure had been viewed as a major impediment for economic growth, for a long time. Even so, as many analysts point out, the public debt has been on a path of gradual consolidation in Sri Lanka, while a large number of countries have been suffering from significant increases in their public debt.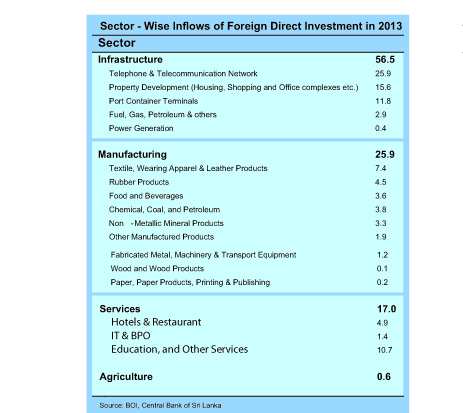
It must also be pointed out that the Medium Term Debt Management Strategy (MTDS) announced by the Central Bank envisages the reduction of the public debt to GDP to around 65 per cent by 2016. In this endeavour, the primary objective of the MTDS is to ensure that the Government’s financial needs are met at the lowest possible cost over the medium term, at a prudent level of risk. As a general principle, pursuing a low level of government debt is a sound strategy for most countries at most times. However, with the structural changes in the Sri Lankan economy and improved infrastructure driven productivity and connectivity, growth is expected to respond positively to the current debt dynamics in the country.
The Central Bank also envisages in its MTDS, to lower the public debt level in the country over the medium-term while encouraging both private and public sector to seek adequate level of investments of around 30 per cent of GDP to support the country’s planned development goals. It is also important to note that with the graduation of Sri Lanka to a lower middle income country and envisaged incremental increase in GDP per capita income, concessional financing will become increasingly short in supply, and the required savings-investment gap needs to be financed via market sources. In this regard, the policy makers have been mindful of the conditions of financing, utilisation of funds and its impact on economic growth to make the country sustain its long-term growth objectives within a prudent debt level.
In another article that appeared in The Sunday Times, Dr. Sandaratne has made certain serious allegations that Sri Lanka’s FDI is based on incorrect data. This allegation has revolved around two dimensions. First, that there is some dispute about the FDI figures; and second, as to whether the magnitude of FDI is adequate and whether the types of FDI that Sri Lanka receives makes a significant impact on the economy in terms of its contribution to the country’s economic growth, especially through exports, and transferring of technology and management skills.
There is no dispute that hairsplitting on figures may be less useful, than focusing on the main issue of growth. However, in fairness to all, it would be better to resolve the dispute regarding the published FDI figures once and for all, and then to address the broader issues.
Let’s take a look at the sequence of events. Dr. Sanderatne claimed that “Foreign direct investment according to the 2013 Central Bank Annual Report (CBSL AR) is falling,…”. The Central Bank responded that “Dr. Sanderatne somehow seems to have missed the fact that the FDI flows have been on a rapidly increasing trend over the past several years.” In response, Dr. Sanderatne reiterated his stance by quoting FDI figures as reported in the CBSL AR. So, on this debate who is right and who is wrong?
Here is the accurate count of FDI data, as published in the CBSL AR 2013. For 2013, as described in the CBSL AR (Section 5.7.1 Direct Investment) p. 145: “Total direct investment comprised US$ 887 million received by BOI companies, $22 million received by non-BOI companies and $7 million received by CSE listed companies not registered with the BOI. In addition to the direct investment amounting to $887 million in 2013, the BOI companies also received foreign loans amounting to $505 million, thereby increasing the FDI received by BOI companies including loans, from $1,279 million in 2012 to $1,391 million in 2013. Consequently, total FDI including foreign loans to BOI companies amounted to $1,421 million in 2013, compared to $1,382 million in 2012.” Nevertheless, in the compilation of balance of payments statistics, Central Bank excludes the loan receipts to BOI companies from FDI inflows (purely on technical grounds), and records the loan component under private sector loans. This exclusion principle is clearly stated in the CBSL AR 2013 (see footnote on page 145). Hence, $1,421 million minus $505 million is equal to $916 million (which is the figure reported in Table 5.8.A of the CBSL AR 2013) as FDI related ‘net incurrence of liabilities’. Now, in the balance of payments summary tables, Central Bank reports a net FDI figure by deducting from the FDI related ‘net incurrence of liabilities’, the amount of direct investment that the Sri Lankan investors make abroad, which was equivalent to $65 million, which gives a net figure $851 million for 2013. This perhaps is the figure that Dr. Sanderatne seems to have used as FDI inflow. Therefore, as it is self-explanatory by now, to describe the net figure so derived as total FDI inflows, without explaining the background, is quite misleading.
Let’s now also examine as to what is the “FDI inflows trend over the past several years”, as per the CBSL. The chart (3) depicts the FDI inflows from 2001 through 2013, along with the trend line, based on the published data in the Central Bank Annual Reports.
This Chart, obviously displays “a rapidly increasing trend”, as it shows a significant increase of absolute FDI inflows. Yet, the CBSL has not, at any time, stated that it is ‘adequate’ and thereby indicated complacency. In fact that is why the CBSL has suggested regularly that efforts must be taken to attract more and more FDIs in to the economy.
Let’s now look at the second dimension of the argument, which deals with the broader issues such as contribution of FDI to the country’s economic growth, especially through exports, and transferring of technology and management skills, among others. Some analysts have contended that the impact of FDI on the Sri Lankan economy has been quite low as “most of the recent FDI has been for the purchase of property for the construction of hotels and recreational facilities that have proved highly controversial too.” This assessment seems quite contrary to the facts on the ground, particularly in the context of the sectoral breakdown of FDI inflows in 2013. As the CBSL AR 2013 describes (p.145), “Infrastructure and manufacturing sectors attracted the highest FDI inflows in 2013. The share of FDI inflows into infrastructure amounted to 56.5 per cent of total FDIs with major investments in telephone and telecommunication networks, housing and property development and ports and container terminals. The manufacturing sector attracted 25.9 per cent of the total FDI, with major investments in textiles, wearing apparels and leather products, rubber products and chemical, coal and petroleum industries. Meanwhile, the services sector attracted 17.0 per cent of the total FDI in 2013, with the continuous expansion of the tourism industry and increased emphasis on foreign investment in education, communication and information technology sectors.” The detailed data on sectoral description on FDI inflows in 2013, is given in a separate table.
From the above table, it should be abundantly clear that FDI flows to Sri Lanka have been towards many industrial export sectors such as textile and garments, rubber products, chemical and mineral products etc. At the same time, the quantum of inflows to the tourism sector must not be trivialised, as it constitutes a major share of Sri Lanka’s export of services. In the infrastructure sector also, the Telephone and Telecommunication Network sector has attracted a major share of FDI inflows, and this sector in the country has also been deepening intensely in the recent years, increasingly applying state-of-the-art technology. Accordingly, the ground conditions do not support the assessment by some analysts on the FDI and its potential impact on the economy.
In conclusion, it must be stated that the argument to suggest that the Central Bank is complacent, as a result of the recent macroeconomic improvements is totally incorrect. The young economists employed at the Central Bank now are very well aware that a fall-out from an unrealistic sense of complacency will be very costly and damaging not only to the economy but also to their careers. Setting achievable and realistic targets by factoring current market conditions and, committing to deliver such targets is not complacency, but a responsible approach to build credibility.
(Dr. Aazim is an Economist at the Central Bank of Sri Lanka. The views expressed in the article are of the writer and not of the institution he is affiliated to).


