How do the numbers on poverty stack up against ground reality?
The Department of Census and Statistics (DCS) recently released the latest Household Income and Expenditure Survey (HIES) for 2016. The survey, carried out in 3-year time blocks gives us information on poverty and inequality in monetary terms. The Centre for Poverty Analysis (CEPA) takes a look at what the numbers say and what our own work on the ground tells us about poverty and inequality.
Income poverty has reduced but is still volatile to shocks
The 2016 survey shows the national poverty head count index reducing from 6.7 in 2012/3 to 4.1. In other words, the number of poor people in Sri Lanka has reduced from 1.3 million in 2012/3 to 0.8 million. The number of people below the poverty line in the former conflict affected regions of North and East too has reduced but some of the districts of this region still report higher poverty head count index than other districts. The relatively higher levels of “squared poverty gap index”, a measure of severity of poverty, in these provinces is an indication that the poor in these areas have not been able to deal with the effects of the long drawn out war. Poverty amongst the plantation community has been reducing since 2010 and the current HIES finds poverty has further declined in the plantation community. However, it needs to be noted that households in the plantation community report an average income (Rs. 34,804) and expenditure (Rs. 34,851), which is much lower in comparison to that of average urban (Rs. 88, 962) and rural (Rs. 58,137) households. Apart from the conflict affected districts of the North and East, Moneragala too reported a higher level of Poverty Head Count Index in past surveys. In the 2016 HIES, poverty in Moneragala has gone down significantly (20.8 to 5.8), but poverty in the Kegalle district has marginally increased, the reasons for these will require further analysis of the data.
The Poverty Head Count Index uses expenses as a measure of determining the poverty levels in Sri Lanka. In this context, the adequacy of income to meet these expenses is an important consideration. For instance, the poverty headcount ratio for Vavuniya in the 2012/3 HIES was quite low at 3.4. However, over 83 per cent (62 per cent in 2009/10 for all respondents) of the non-poor in Vavuniya were indebted with 62 per cent (36 per cent in 2009/10 for all respondents) of them resorting to pawning. Whilst acknowledging that the 2012/3 HIES did not ask the purpose for which loans have been taken– consumption or investment – CEPA’s own studies in the North show that people engaged in manual work are unable to repay loans taken due to a lack of sufficient income. The seriousness of the issue was reflected in the recent visit to the Northern Province by the Governor of the Central Bank of Sri Lanka to specially review reported indebtedness. We are finding that the lack of industries in the North has meant that people continue to rely on agriculture, fisheries, remittances or government jobs. Women, especially single headed families, face their own vulnerabilities and difficulties in making a living due to the prejudices of society. These circumstances which determine a person’s ability to improve their lives are hidden in aggregated statistics.
CEPA is finding similar patterns in the other rural areas as well. The asset base of rural households has indeed improved, but many depend on government jobs for income, including in the armed forces or Civil Defence Force and/or migration to other countries, because agriculture is not providing a stable and sufficient source of income. In many parts of the country, we have found that due to the consecutive failure of the monsoons, farmers have been forced to take on manual work in the construction industry, migrate out of the area to provide for their families or depend on handouts from the government and non-governmental organisations. This also indicates how environmental threats can destabilize jobs and earning capacities resulting in alternatives that may be providing lesser value jobs. Thus, we have to ask the question whether our ‘middle income’ economy is indeed geared to provide decent employment and to what extent a government with an increasingly stressed fiscal space can keep providing government jobs including to the relatively educated whom the industry would not or unable to absorb.
Wellbeing is restricted and stagnates because of inequality
The average household income amongst the richest quintile in 2016 is Rs.158,072 while the poorest quintile is Rs 14,863. Thus while the poverty levels have come down, inequality measured by Gini Coefficient of Household Income in 2016 remains high at 0.45 and has only marginally declined from 0.48 in 2012/3.
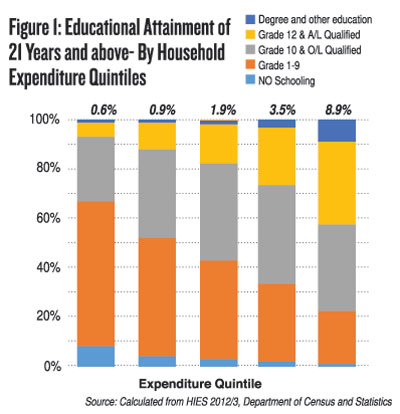
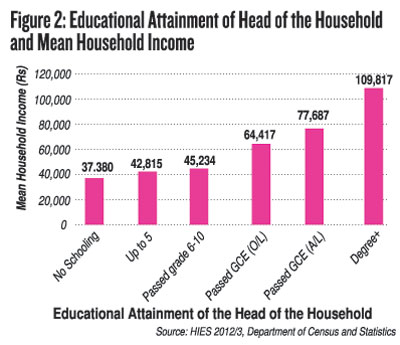
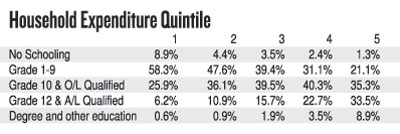
The continuing high income inequality is indeed a point of concern and the effects of inequality are observed even in the outcomes of educational attainment which is offered free up to tertiary levels. While the causality is not clear, Figure 1 does postulate that educational outcomes are more biased towards the rich. In a context where higher levels of education do allow Sri Lankan households to increase their income and thereby reduce poverty (Figure 2), members of poorer families appear to require additional support to access and improve their outcomes from the education system. CEPA studies too, point in this direction. Caste related issues are found to constrain access to general education in the North, resulting in lower levels of education attainment for children from households lower down in the caste hierarchy.
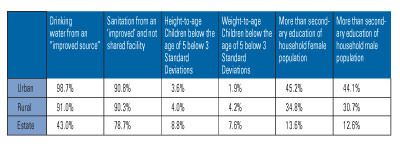
In another study we found only one graduate in a 650 unit apartment block housing Colombo’s underserved settlements. We also note that of the government schools that have advanced level classes, only 30 per cent have a science stream and on numerous occasions, we have come across students qualified to do advanced level, following courses not of their choice due to their family’s inability to support education in a distant resourced school. Similar vulnerabilities are observed in health outcomes (Table 1), indicating that here too, some communities would require additional support to access and benefit from free health services.
In conclusion, economic growth, long standing investment in education, health and rural infrastructure and assistance through social protection programmes, have enabled the reduction of poverty in Sri Lanka. Additionally, current measures such as enhanced incentives for those investing in the North and East, and an extended period of compulsory education with the introduction of vocational education are certainly important measures for investment, employment creation and improving capacities. But, as noted above, a number of communities within Sri Lanka, such as those in the war-affected North and East, rural communities dependent on agriculture, plantation communities, people affected by natural disasters and even people resident in Colombo’s urban underserved settlements are not necessarily in a position to benefit adequately from available services such as education and health which can improve their quality of well-being. Thus while consideration is given to reducing poverty through increasing income, Sri Lanka’s policy makers, also need to pay equal attention to ensure equity of access and provision of services in order to improve equitable development outcomes.
| Table 1: Health and Educational outcomes by Sector | |
|
|


