Voronoi Diagrams
View(s):When you use your mobile phone to talk to another person, the phone converts your voice into an electrical signal and transmits to the nearest cell tower of your network provider, through radio waves, before it converts back to sound for the person at the end to follow.
The network provider may have many cell towers and your call is connected to the closest tower. How do you find
out where the closest tower is?
A Voronoi diagram will provide the answer.
A Voronoi diagram is a simple concept based on the minimal distance needed to reach a point of interest. It is named after the Russian mathematician Gregory Voronoi
(1868 – 1908). Boris Delaunay, a student of Voronoi, developed a method of obtaining triangular regions, which is an important aspect when creating Voronoi diagrams. These diagrams can be constructed by hand or using computer imaging software.
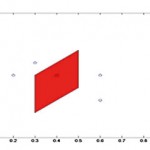
Let us consider the situation of obtaining the Voronoi cell (region) containing D, if you are given four points A, B, C and D. First, you need to plot these points on coordinate axes. Now draw the perpendicular bisectors of AD, BD and CD. The triangle obtained is the Voronoi cell containing D. You will notice that every point in the cell is closer to D than A, B or C. Try it, using the following coordinates. A(1,1), B(3,5), C(5,3) and D(3,3).
The diagram below shows the Voronoi cell containing the middle point given 4 other points around it.
To complete the Voronoi diagram, the process has to be carried out for all points. In the diagram, if you also consider the four corner points of the coordinate axes, the following diagram can be obtained.
Drawing Voronoi diagrams by hand is a time consuming and complicated process. Mathematicians often use mathematical or imaging software to make it simpler.
Voronoi diagrams have applications in many fields. Biological structures can be illustrated using them.
In aviation, they are used to identify
the nearest airport in case of diversions. In mining, they can help
estimate mineral resources based on
preparatory drill holes.
In epidemiology, they can help in the identification of the source of infections.
Voronoi diagrams can also be used to find a location as far as possible from the existing locations such as supermarkets, petrol stations and even schools.


