Wanted: New consumer price index
Price statistics are important because they are used in analysing economic
activities and in formulating economic policies, according to a report
by Sri Lanka's reputed think-tank, the Institute of Policy Studies (IPS).
"Price changes should be closely monitored as they affect other macro
economic variables like production, employment, as well as interest and
exchange rates. They also affect income and wealth distribution and resource
allocation," the report titled, "The problems of measuring the cost of
living in Sri Lanka", authored by R.M.B. Korale, a retired director of
the Department of Census and Statistics (DCS), noted.
Here are extracts of the report:
This paper describes the consumer price indices that are currently compiled
in Sri Lanka and discusses the problems associated with their construction
and their limitations.
Nature and uses of a CPI
The purpose of a consumer price index is to measure changes over a period
of time in the general level of prices of goods and services that a reference
population acquire, use or pay for consumption.
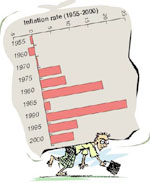 Sri
Lanka's inflation has seen some erratic swings in the past 50 years. The
top line on the graph shows the percentage increase from 1955 to 2000.
Inflation was 0.6 percent in 1955, 1.6 percent in 1960, 26.1 percent in
1980, 1.5 percent in 1985, 21.5 percent in 1990 and 6.2 percent in 2000. Sri
Lanka's inflation has seen some erratic swings in the past 50 years. The
top line on the graph shows the percentage increase from 1955 to 2000.
Inflation was 0.6 percent in 1955, 1.6 percent in 1960, 26.1 percent in
1980, 1.5 percent in 1985, 21.5 percent in 1990 and 6.2 percent in 2000.
According to this concept, a CPI has the following components: reference
population, market basket and weights, sample outlets, base period, index
method and price collection system.
The reference population indicates the population that falls within
the scope of the index and this target population should be clearly defined.
The selected population for the index could be the low-income group, the
middle-income group or all income groups taken together.
A market basket is the term used to refer to a sample of goods and services
that is used to represent all goods and services purchased or used by the
reference population. Weight is a value attached to a commodity or group
of commodities (or services) to indicate its relative importance in the
market basket.
The household consumption of the reference population disclosed through
a well-designed Household Expenditure Survey (HES) is essential to determine
the market basket and weights of the items for which prices will be collected.
The base period is the duration, usually a year at which the index is
set to 100 and is the reference point of the index number series.
It is equally important to establish and operationalise an efficient
and reliable system for periodically collecting and recording prices of
goods and services selected and included in the index. The quality of the
price data is the crucial determinant of the reliability of the index.
History of the CPI
The consumer price indices have been compiled in Sri Lanka for about 60
years and the history of these indices dates back to the commencement of
the Second World War in 1939. From about 1940 until 1952, two indices had
been computed, the Colombo Working Class Index (CWCI) and an Estate Labour
Index Number (ELIN). The first was constructed by the Department of Commerce
and Industries until the establishment of the Department of Census and
Statistics (DCS) in 1947.
The Colombo Consumers' Price Index (CCPI), which replaced the CWCI is
based on a family budget survey conducted by the DCS in 1949-50 of 455
working class households in the Colombo Municipality. The expenditure data
obtained from this survey were revalued at 1952 prices to determine the
weights of the new CCPI, which came into operation from the beginning of
1953.
The CCPI commodities and services selected for pricing have been adjusted
on a number of occasions over the years to incorporate additional items
and for other reasons.
Greater Colombo Consumers' Price Index
The Greater Colombo Consumers' Price Index (GCPI) was introduced in 1989
based on the results of the nationwide Labour Force and Socio-Economic
Survey (LF and SES) conducted in 1985-86. The survey, which canvassed data
on household income and expenditure as well as on employment and unemployment,
was conducted in 12 monthly rounds and therefore it was able to capture
seasonal variations in household consumption. The survey sampled 25,000
households nationally and over 1,000 sampled households fell within the
greater Colombo area, which was considered adequate to derive weights for
the construction of a CPI. The GCPI weights are based on the household
expenditure of the lowest four expenditure deciles in the greater Colombo
area. The scope and coverage of the GCPI is wider than the CCPI.
Colombo District Consumer Price Index
The Central Bank of Sri Lanka has introduced the Colombo District Consumer
Price Index (CDCPI), which was first released in 1998. The household expenditure
of the first four decile groups from the Consumer Finance and Socio-Economic
Survey 1996/97 had been selected to derive the weights for the CDCPI. The
geographical coverage of the index includes both the urban and rural areas
of the Colombo district. Thus, unlike in other indices produced hitherto
in Sri Lanka, the rural sector (in the Colombo district) too had been brought
within the scope of the index.
The reference period of the index is October 1996 - September 1997.
About 200 items had been included in the market basket. The prices are
collected in the Pettah market and four markets and four fairs located
in the Colombo district. Schoolteachers engaged by the Bank are used as
price data collectors who collect data from retail outlets through personal
visits to the selected outlets. Around 1,800 price quotes are collected
each month to update the index.
Inflation trends
Three indices are currently available for measuring inflation - the CCPI,
GCPI and the GDP deflator. In addition, the Colombo District Consumer Price
Index (CDCPI) constructed by the CBSL is also available. The CDCPI, which
was introduced in 1998, covers the past three years only.
The index value of the CCPI has increased from 100.0 in 1952 to 2,539.8
by the end of 2000, which averages to 50.8 index points per year or at
an average annual inflation rate of 7.0 percent. This average annual increase
in the CCPI from inception to 2000 has varied significantly in different
time periods, which could be divided into four, namely 1952 - 1966, 1966
- 1976, 1976 - 1987 and 1987 - 2000 based on the variations in the CCPI
growth trends. Undoubtedly, important economic policy developments including
devaluation of the rupee, removal of price controls and subsidies, large-scale
investment programmes and deficit budgets financed through expansionary
sources caused the CCPI to increase with corresponding levels of inflation
in the different time periods. In addition, there were other issues such
as the oil price shocks, and increase in import prices of consumer items
that also contributed to inflation.
The period 1952 - 66 was a period of low inflation where the recorded
inflation rate was less than one percent and where the total increase in
index value in rupees had amounted to less than Rs. 25 for the entire period.
The low inflation was due to a number of factors including maintenance
of a fixed exchange rate since 1949, shortages of essential food items
which were met by imports, which helped to curb any sharp, price increases,
maintenance of price controls, rationing and subsidies.
There had been moderate inflation of around 6 percent per year during
1966 - 76. The average annual increase in the value of the market basket
had amounted to Rs. 340 per year during 1994 - 2000.
The GCPI has shown a lower inflation trend than that recorded by the
CCPI. In its first few years from 1990 to 1993, although GCPI inflation
rates were lower, yet the higher value of a unit of the GCPI market basket
in rupees had returned higher rupee values for the increase in the GCPI.
Problems of measuring the cost of living
Since the CCPI is used in estimating GDP aggregates, it is doubtful as
to what extent the GDP deflator can be treated as an independent indicator.
In the context of large gaps in data, it becomes necessary to adopt
several different methods and techniques in preparing current estimates
of national accounts aggregates. Where production data is not available,
per capita consumption derived from household expenditure surveys are used
after adjustment for population growth and change in prices in estimating
these aggregates. The component or sub-group price indices are used for
effecting adjustments for changes in prices. For instance, in the absence
of reliable and comprehensive data on items such as other food crops, fruits
and vegetables, this method of compiling estimates is usually adopted.
This procedure is also used for products and services produced by small-scale
industries and cottage industries and for such items as unorganised transport.
Conversely, the component sub-indices of the CPI are normally used for
deflating components of the private consumption expenditure in order to
obtain the constant price estimates of national accounts.
Need to replace the current CPI
The fact that the CCPI was outmoded and that a new index should be introduced
was accepted as far back as 1958, about six years after the CCPI was introduced
and about ten years after the Family Budget Survey of 1949 - 50, on which
the CCPI was based, was carried out. The Minister of Finance had appointed
an official committee to revise the cost of living index in November 1957.
The terms of reference of the committee were: to design and supervise the
execution of a realistic cost of living index or indices of the middle
and lower income groups; to examine the need for separate indices to reflect
the cost of living in particular areas; and to prepare such indices. Thus,
it was evident that by the end of the 1950s, the CCPI had to be substituted
by a new index or indices widening the coverage that was restricted to
working class households in Colombo, increasing the coverage to middle
income groups, and the geographic coverage at least to other urban areas.
Issues and problems
There are several types of issues and problems connected with the compilation
of price indices. Some of these issues are concerned with the concept the
price index itself, and others relate to price index structure, design
and compilation.
In a new family budget inquiry that was undertaken in 1958 in Colombo,
it was found that there had been an increase in the expenditure on food
items from 61.2 percent to 62.2 percent. More importantly, within food
expenditure, the expenditure on cereals and cereal preparations had declined
from 19.1 percent to 16.9 percent while the expenditure on fish, meat,
milk and eggs had increased from 12.9 percent to 15.4 percent. Further,
the expenditure on clothing had declined from 8.2 percent to 5.1 percent
of total expenditure. There was thus a distinct shift in the pattern of
consumption expenditure by 1958, ten years after the 1949 - 50 family budget
survey. Such changes in the consumption patterns are very likely to have
occurred in the past decades too, confirming that the CPI should be updated
using results of new surveys on a regular basis.
Current consumption profile
A CPI should be based on the current consumption patterns of the reference
population. Changes in consumer taste, fashion and technology cause the
fixed market basket of goods and services to become outmoded and thus they
may no longer represent what consumers commonly buy. The weights used in
CCPI are outdated. Consumption patterns have changed significantly during
the past five decades, even in the case of GCPI, in which the weights are
a decade-and-a-half old. CPI weights are generally accepted to be sufficiently
representative for a period of 5 - 10 years from the date of the survey.
The CCPI is based on the weights of working class families that received
Rs. 50 to Rs. 485 per month in 1949/50. The average expenditure value of
the sampled households amounted to Rs. 185.27 and after re-valuation in
1952 prices, this amount increased to Rs. 202.24. Further, a high proportion
of the reference population from which this sample was drawn has moved
out of Colombo to the suburbs because of the high property and rental values.
Thus, the continued collection of prices for compiling CCPI from the markets
in the municipality of Colombo is unrealistic and meaningless in the context
of these developments.
The items in the CCPI have been adjusted on a number of occasions over
the years to make substitutions for missing items, accommodate quality
differences and for other reasons. Many of the items that are in the consumption
basket of the working class households have substantially changed and new
items have been introduced. The specifications that were prepared for price
collection at that time have also been changed for many items. These modifications
have changed the structure of the CCPI and may no longer be a sensitive
indicator of current changes in consumer prices.
House rent excluded
There are several issues that relate to the rental component of the index.
In the CCPI, except at the inception of the series, the house rent has
been frozen. Thus, the all item index in that sense, does not reflect the
actual movement of the prices of the total market basket of goods and services
for which the index was designed. DCS has not published an index excluding
the rental component.
The house rents in urban areas have escalated, the extent of escalation
being similar to the increase in land values. The rental component has
not been accurately measured in the statistical surveys conducted recently.
There are several problems in measuring house rents. The majority (in 1981,
70 per cent of all housing units and 58 per cent in urban areas) of housing
units are owner occupied units and it becomes necessary to ascertain the
imputed value of house rents from owner-occupiers.
Many such respondents find it difficult to provide an accurate assessment
of the imputed value of house rents. There is also subsidised housing provided
to government and local authority employees and to employees of some firms.
What such respondents often provide are not market rents but the subsidised
rents paid by them. Further, there is the issue of rent controlled houses
where the tenants report the subsidised rent they pay in terms of the rent
control legislation. These measurement difficulties have lowered the rental
component of household consumption reported, and there are large differentials
in the share of housing reported through these surveys.
Index weights
It has been observed in practice, that it is difficult to measure certain
items of goods and services in the consumption basket through multi-subject
household expenditure surveys. For instance, all the surveys conducted
by DCS in the recent past have not been able to obtain realistic estimates
of liquor and tobacco, personal care items, food consumed outside the household,
etc. CWCI and CCPI weights for liquor and tobacco were of the order of
7 percent to 8 percent and that of the GCPI amounted to only 3.8 percent
of total consumption.
Conclusion
Over a period of time there are changes in the availability of goods and
services, with some items disappearing from the market and other new goods
and services entering the market. These changes in the availability of
goods and services and developments in the economic and social conditions,
invariably result in important changes in the consumption patterns of different
sections of the population. In a developing country such as Sri Lanka,
which is increasingly exposed to globalisation and foreign trade, the consumption
patterns will be subject to accelerated changes. This means that the indices
that are compiled will have to be updated regularly.
None of the currently compiled indices are reliable indicators of inflation
in Sri Lanka. The CPI and GCPl are dated and no longer representative as
measures of inflation. In addition, the surveys on which the weights are
based have not been able to realistically capture some major items of household
consumption and as a result, the weights of those consumption categories
are under-estimated.
A new CPI should be based on a specially designed HES that is undertaken
purely for deriving weights for CPI. There are many expenditure categories
and items that are found to be increasingly difficult to measure through
household based surveys for example, food consumed outside the household,
liquor and tobacco, personal care items, education (tuition) and transport
expenses. The usual arrangements made to collect data from the head of
the household or other knowledgeable member of the household, have been
found to be inadequate in practice to collect complete and comprehensive
data on household consumption. It is now recognised that it is essential
to interview all members or several members of a household to collect the
required information. |