 |
 7th March 1999 |
Front Page| |
Going together: growth and equityMany of the country's eminent economists gathered together recently to pay homage to the Nobel Prize Winner in Economics, Professor Amartya Sen. It was part of the symposium organised by the Marga Institute to felicitate the Nobel Prize winner. Many of those present had known him personally. So the symposium aptly named, Amartya Sen, a tribute to a scholar, colleague and friend, rang true as the speakers who recounted personal incidents in the life and work of the economist and philosopher. Indeed, Sen not only held the chair in economics, but was also the Professor of Philosophy at Harvard. Even that is not correct we were told as he could teach in any discipline if he so desired. He is now in the prestigious position of Master of Trinity College, Cambridge. We have chosen to comment on Sen owing to the sensitivity he has displayed for the common man and placed the concerns of the poor at the centre of economic growth. The Bengali famine, which killed millions, occurred in India when he was a youth. What struck young Amartya was that while millions died, he knew no one who had no food. This led him to refashion the perspectives of economics and place an emphasis on the issues of distribution. Equity in distribution became as much a concern to him as growth. An increase in per capita incomes was of lesser significance if the fruits of growth were not equitably distributed. On many occasions he questioned the high per capita incomes of certain countries co- existing with poor attainments in education and health. What was the point, he asked, in Mexico or Oman having a per capita income several times that of China or Sri Lanka when their expectation of life and literacy were lower than in China and Sri Lanka. Economic growth he pointed out was a means to the attainment of human capabilities, not an end in itself. Economic growth and increases in per capita income could never be the objective of human life; they were means to the attainment of other objectives. He was an economist who held up Sri Lanka's attainments as a correct prioritisation of economic policy. He gave distribution of the fruits of economic growth as important a role as growth itself. Sen's perspectives have influenced development strategies recently and modified the economic approaches of multilateral agencies. Sen together with other economists, like Mabul al Haq of Pakistan, influenced the development of the Human Development Index which attempted to capture other dimensions of economic and social development.Consequently, many third world countries have modified their policies to ensure a more balanced development, with higher investment in human capital. They are now much more concerned with the issues of distribution and interventions to improve nutrition, education and health. Sri Lanka's development experience has demonstrated that it is possible to achieve high levels of social development with low per capita incomes. More recently it is also becoming clear that unless the economy grows and expands sufficiently the sustainability of welfare measures becomes difficult. It is also important to note that the sustainability of social expenditures becomes severely stressed when defence expenditures are high. The lessons of our experience make it clear that we must maintain our momentum of growth if we are to achieve higher levels of education and health. We must also ensure that these expenditures are not eroded by excessive expenditures on unproductive, spurious welfare measures. Sen's emphasis on growth and equity has a special relevance for Sri Lanka.
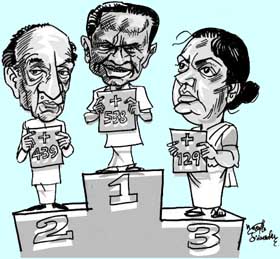
Who's the winner?By Professor, C.M.Madduma Bandara, University of Peradeniya.A statistical comparison of the economic performance of three governments under executive presidency. The first four years of any democratically elected government represents
two-third of the period of its legitimate tenure of office. It is therefore,
natural that a public debate had ensued regarding the However, it is distressing to note the absence of any objectivity in the statements often made, which are purely of a political nature. The inherent difficulties in the measurement of performance of governments is compounded by the indiscriminate use of mass media by the politicians in power that tends to confuse the public mind - a situation that becomes ideal to exercise power without accountability or social responsibility. In the modern society, the running of a government, if greater efficiency is to be achieved, has to be based on principles similar to those of managing business enterprises. As the old saying goes, 'for forms of government let fools contest; whatever is administered best is best'. The primary objective of this note is to stress the need for and highlight the importance of developing objective criteria for the complex task of assessment of the performance of governments. The technique adopted here is simple to make it convenient to the reader, and therefore, no claim is made that it is the most perfect. There are certainly many ways of improving upon it. It is now widely felt that in general terms, the policies adopted by the present government are not fundamentally different from those of the previous government. In many spheres, the continuation of same programmes often under different banners and titles, is now abundantly clear. Even in the tactics adopted, there appear to be hardly any difference, as could be seen in the blatant and biased use of state controlled media, in election frauds and in the ruthless suppression of any opposition or, different points of view. This broad parallelism between the regimes that ruled since the introduction of the executive presidency, for which the present government is also now badly addicted, provides a common basis for comparison. lt is therefore, argued that the statistics published primarily by the Central Bank, may prove to be a common platform and a useful index of the relative levels of performance. It is granted that, sometimes statistics have their own drawbacks and pitfalls. It was not a long time ago that Central Bank Governors were accused of producing their own statistics. If such elements of doubt prevail, it may be argued that they too can be common during all regimes. Further, the Bank also publishes a vast array of social and economic indicators out of which selection of a suitable set of significant performance measures can pose certain problems. At the same time, the statistics published by the Bank does not include clear indicators regarding many important issues that affect people, such as the management of the war. ln this regard one has to resort to other latest publications and sources on the subject. Further, since the latest 1998 statistics are still not fully available, only the first three years' performance of each government had to be chosen for this analysis. The Table of Statistics given here reflects the performance during the first three years of the governments of three elected executive presidents. The 18 indicators chosen here refer to some vital aspects of living and well-being of the people in Sri Lanka, such as the cost of living, wage rates, unemployment, and the resultant level of misery. In an ideal situation the list should have been longer and different weights should have been assigned to more important indicators. Any number of indicators could be accommodated in advanced statistical analyses by the powerful computer facilities of the modern age. It is however, obvious that the selected indicators cover a wide range of issues that seriously affect the people and the country. The simple statistical method adopted here is to compare the statistics of the first year of assuming office with those of the third year. In the column indicating '%change', a plus or a minus value is computed to indicate the achievements or failures. Finally, '%change' values are added up to obtain a 'cumulative %' value, which is taken as an indicator of the overall performance under different regimes. As could be seen from the overall performance statistic, the performance during the first few years of two former presidents had been far better than that during the present government. It is interesting to note that the best performance was during the period of the late President R. Premadasa with a leading score of 538. The worst was during the present government which could obtain only 129 points which is less than one fourth of the former. The score for the period of late President J.R. Jayawardene i.e. 439 may perhaps seem relatively lower than that expected by some, considering the massive development projects undertaken during the period. Obviously, the increase in foreign debt and the misery index have eaten up much of the scores for that period. On the other hand the performance of the Premadasa regime was good all round having only two minus points compared with six minus points for the Jayewardene regime and five minus points for the present government. Different analysts, some of course with vested interests, may level several criticisms against the technique adopted and the interpretation of its results. One may say that the three periods chosen are not comparable in the context of macro-economic trends or in terms of the status of civil turmoil. In terms of civil disturbances of course, Premadsasa period suffered most, both from the problems in the South as well as those in the North, but could forge ahead with a reasonable level of development activity while controlling inflation and unemployment with the assistance of a group of highly competent advisors. The greatest weaknesses in the present government appears to be in the fields of finance, agriculture and in the management of war. Two of these subjects come directly within the purview of the President. In particular, the management of the economy without a full fledged Finance Minister, and the poor selection of persons for advisory roles, may account for many minus points. The poor performance in agriculture may largely be due to conflicting policy directions between production and trade which in turn are largely due to the dictates of some external lending and funding agencies. The tourist arrivals on the other hand, reflects the stability and security situation in the country. An attempt has also been made to compare the first 'four year' periods with whatever the statistics available for 1998; but that too indicates generally the same pattern giving an even worse performance scenario for the present government. This leads one to the important question that, despite all state propaganda, whether the country is on a slippery slope in terms of economic performance and whether we are heading for a similar economic disaster as that being experienced now in some South East Asian countries. The warnings and 'wake up calls' sounded recently by some knowledgeable persons perhaps indicate that, we may not be too far from an impending catastrophe. The First few Years A Statistical Comparison of the Performance of Three Governments Under Executive Presidency Performance Time Period Indicator 1977-1980 %change 1989-1992 %change 1994-1997 %change (1) Price Indicator (100=1952) 203.2 - 318.2 -57 830.2 - 1260.4 -52 1527.4 - 2089.1 -37 (2) Wage Rate Index (WBtrades) 66.2 - 147.3 +123 388.1 - 590.0 +52 712.4 - 849.1 +19 (3) Unemploment Rate (%) 16.4 - 16.9 -3 15.8 - 14.6 +8 13.1 - 10.4 +21 (4) GDP Growth Rate(%) 4.2 - 5.8 +38 2.3 - 4.3 +87 5.6-6.4 +14 (5) Total Investment (%GDP) 14.4-33.8 +135 21.7-24.3 +20 27.0-24.4 -11 (6) Total External Assets ($ Mill.) 358.1-375.9 +5 584.6-1439.9 +146 2607.8-2820 +8 (7) Govt. Foreign Debt (%GDP) 20.9-41.4 -98 73.6-70.4 +5 74.5-55.8 +34 (8) Tea Production (Mill. Kg.) 209-191 -9 207-179 -14 242-277 +14 (9) Paddy Prouction (MT1000) 1677-2133 +27 2063-2340 +13 2684-2239 -17 (10) Industry (Val of Prod Rs. Bill.) 7.0-18.3 +161 64.9-1.136.1 +110 190.6-303.1 +59 (11) Employment in Industry (1000) 114-132 +16 669-684 +2 756-838 +11 (12) Power Generation (GWH1000) 1.22-1.67 +37 2.86-3.54 +24 4.36-5.1 +17 (13) Tourist Arrivals (1000) 154-322 +109 185-318 +72 408-366 -10 (14) School pupils (1000) 2566-3399 +34 4180-4285 +3 4328-4342 +1 (15) University Students (1000) 14.35-17.31 +21 24.64-31.45 +28 30.76-34.14 +11 (16) Hospital Facilities (1000beds) 39.88-42.90 +8 45.72-48.16 +5 49.28-55.44 +13 (17) War Casualties (SL Troops/ LTTE deaths per year* **180/158 -12 ***998/1244 +25 ****1814/1343 -26 (18) Misery Index (Inflation Rate + Unemployment Rate 20.9-40.9 -96 27.1-26.0 +4 21.5-20.0 +8 Overall Performance (Cumulative % Change) +439 +538 +129 Sources of Data: Central Bank Annual Reports Central Bank (1998) Economic Progress of Independent Sri Lanka *Rohan Gunaratna (1998) Sri Lanka's Ethnic Crisis and National Security ** Averages for 1983 - 1987, *** for 1990-1994; **** for 1995-1997
Export growth plunges to 2.1 per cent in 98Export growth has stumbled from 13% in 1997 to 2.1% in 1998. The global economic slowdown following the Asian and the Russian crises would continue to affect Sri Lanka's exports in 1999, a leading broking house has predicted. "We expect export growth to slowdown further in 1999 to a moderate 0.5 per cent. Export growth dropped to a low of 2.1% last year despite a 5.8 per cent increase in revenue from tea exports," John Keells Stockbrokers said. Tea exports which constituted around 70 per cent of total agriculture exports are expected to further decline in 1999. "We expect tea export revenue in US$ terms to decline 5 per cent in 1999 from 1998 levels. This would primarily be on account of lower tea prices due to higher global supply and the effect of the Russian contagion continuing through 1999", the report said. Textile and garment exports which spearheads the industrial export category with an approximately 66 per cent weightage, grew 8.2 per cent in 1998. "We expect the textile and garment exports to record a 10 per cent growth in 1999. Incidentally, textile and garment exports grew 19 per cent in US$ terms in 1997. Mineral exports, including the export of gems, would continue to feel the competitive pressures in 1999. Mineral exports which fell 33 per cent in 1998 expected to decline 15 per cent in 1999" the report said. |
||
 |
Front Page| News/Comment| Editorial/Opinion| Plus | Sports | Mirror Magazine |
|
 |
Please send your comments and suggestions on this web site to |
|
 performance
of the government presently in office.
performance
of the government presently in office.